Great news, newsmakers and marketers! You can now learn more about your audience by looking at your content performance with greater magnification.
Apester Analytics now allows publishers and marketers to track their content performance from the macro perspective of a content channel, all the way down to the micro level of slides – this makes Apester the most comprehensive analytics dashboard for a Story player in the market.
A higher resolution of analysis of units and slides will provide you with better feedback to create better content and promote higher engagement.
Launched in 2018, Analytics offers a broad set of metrics that lets you view the big picture around engagement and monetization of each story, poll, or quiz created within the Apester platform across locations and platforms.
Try the new Analytics features:
- Go to https://app.apester.com/dashboard
- Choose ‘Analytics’
- Choose ‘Units Overview’ and start exploring further!
Revenue, Time on Site & CTR Dashboard
Get the full rundown on revenue, engagement, and time on page added from each piece of interactive content, and compare them to past performances. A count of the days passed since your last creation of Apester content additionally reminds you that it’s time to engage your audience with new content.

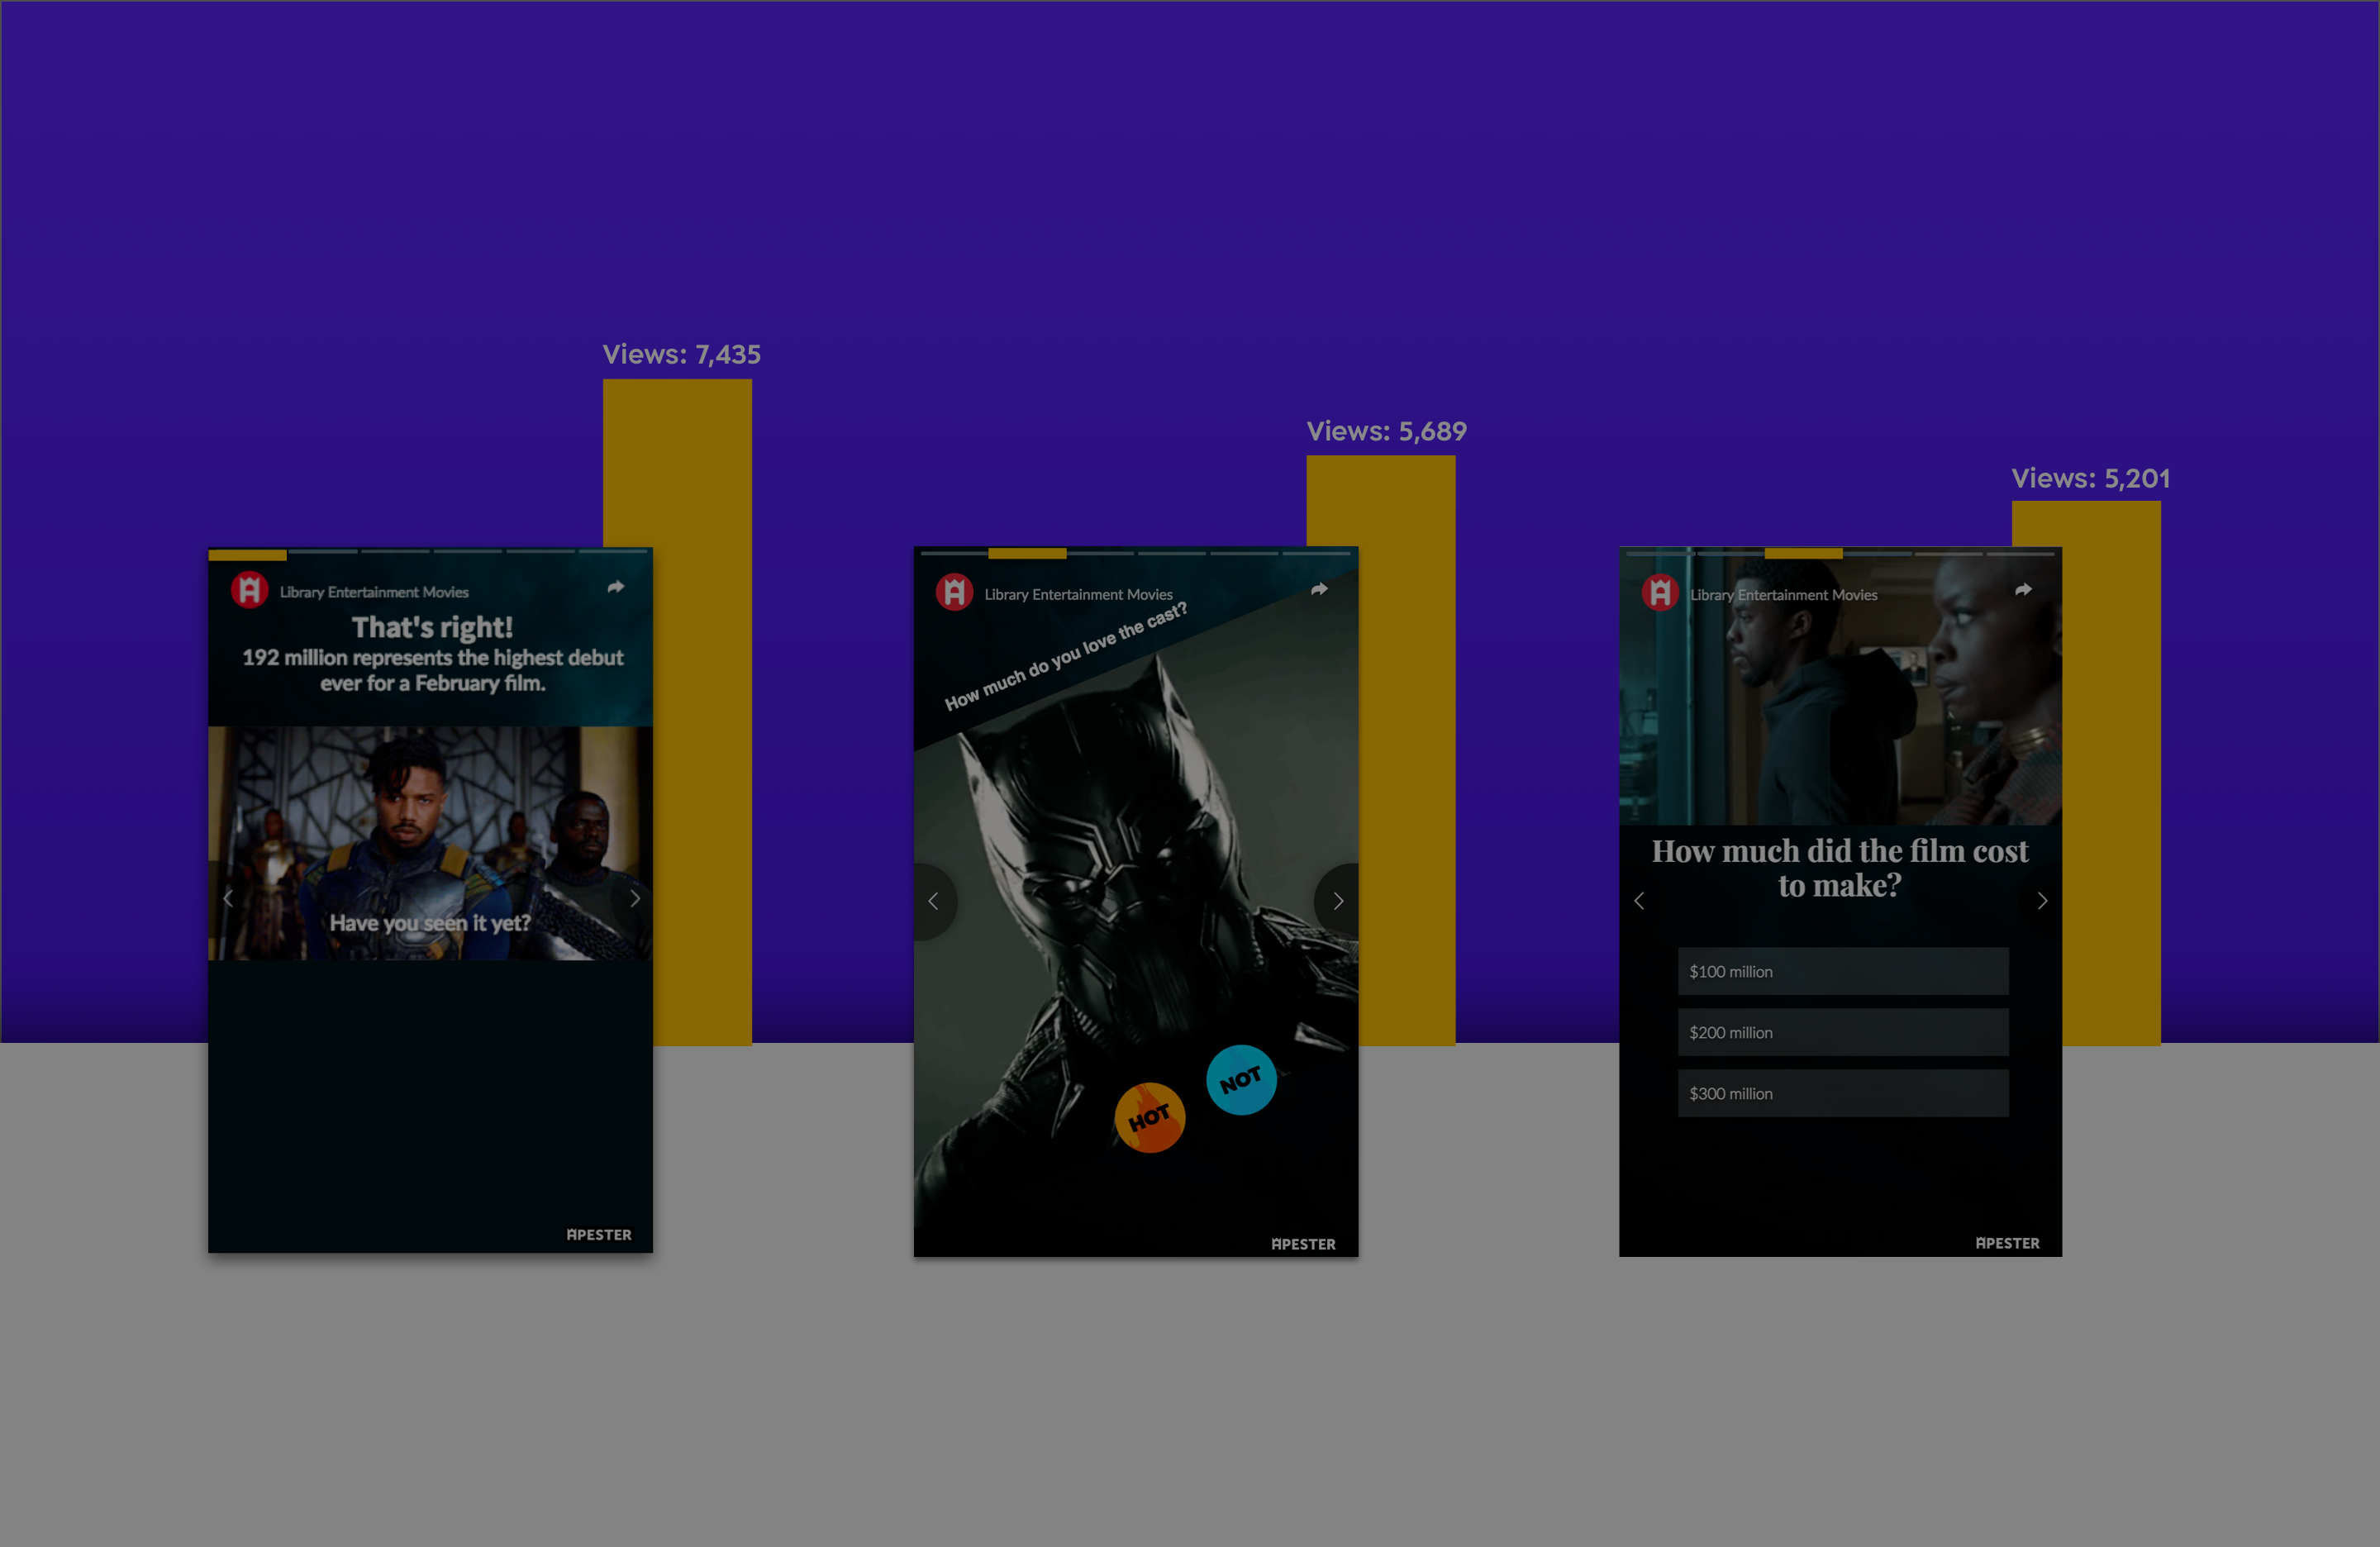
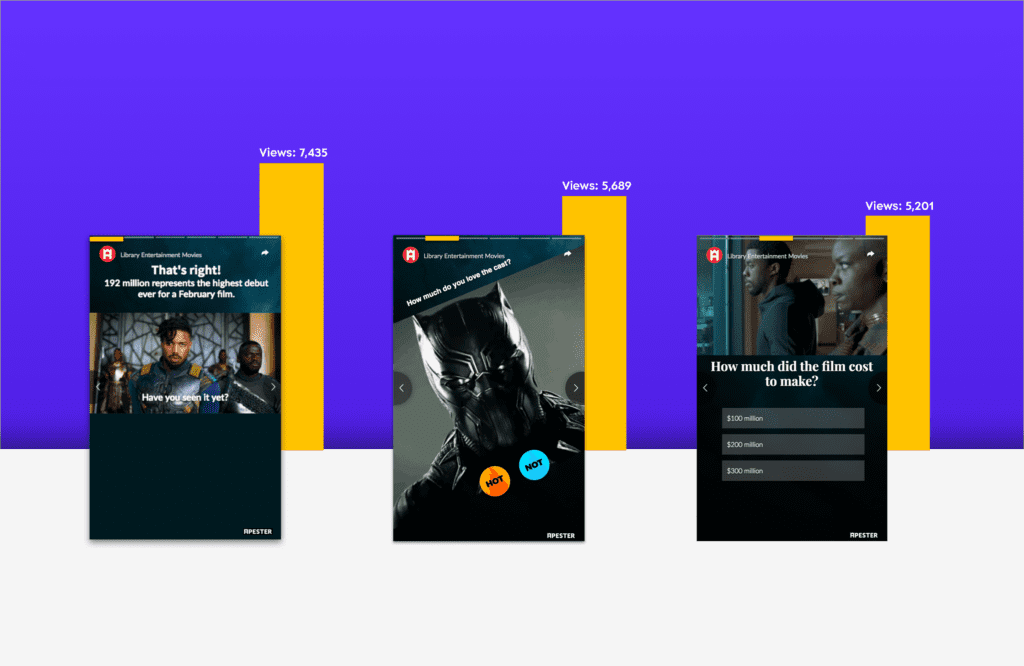
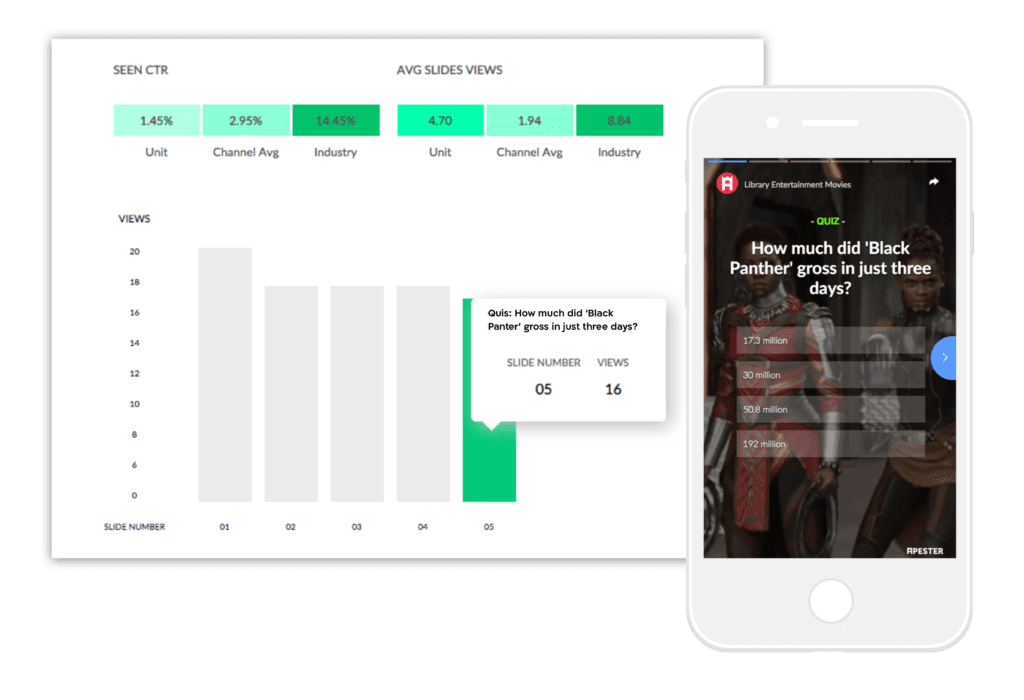
Units & Slides Dashboard
Apester is today’s most advanced analytics dashboard for a Story player. With the new units and slides dashboard, you can now discover audience retention for every story, quiz, or poll, and get a closer look at each slide to check out growing or churned views. Compare each unit’s performance to your historic performance or to the industry average.
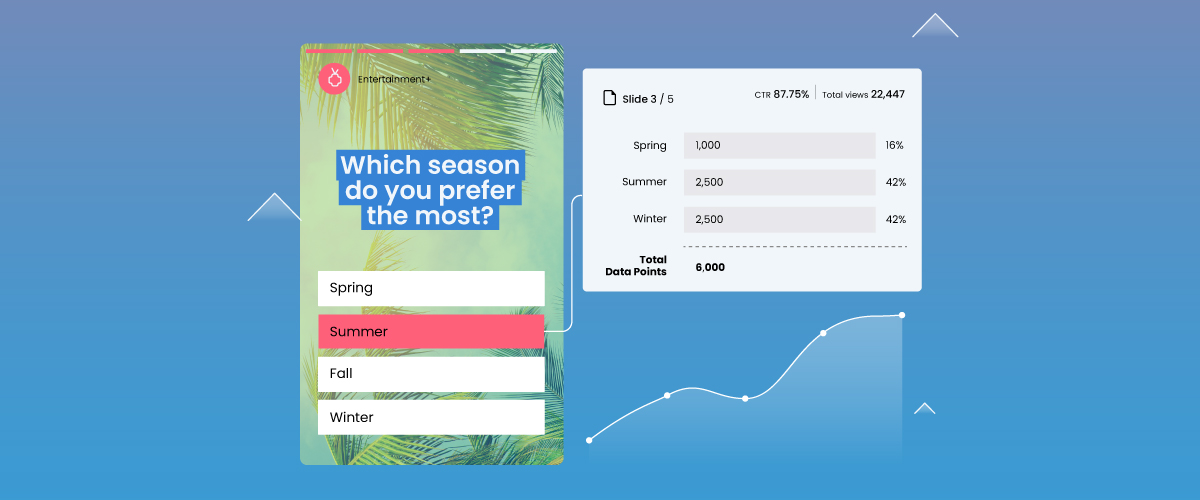
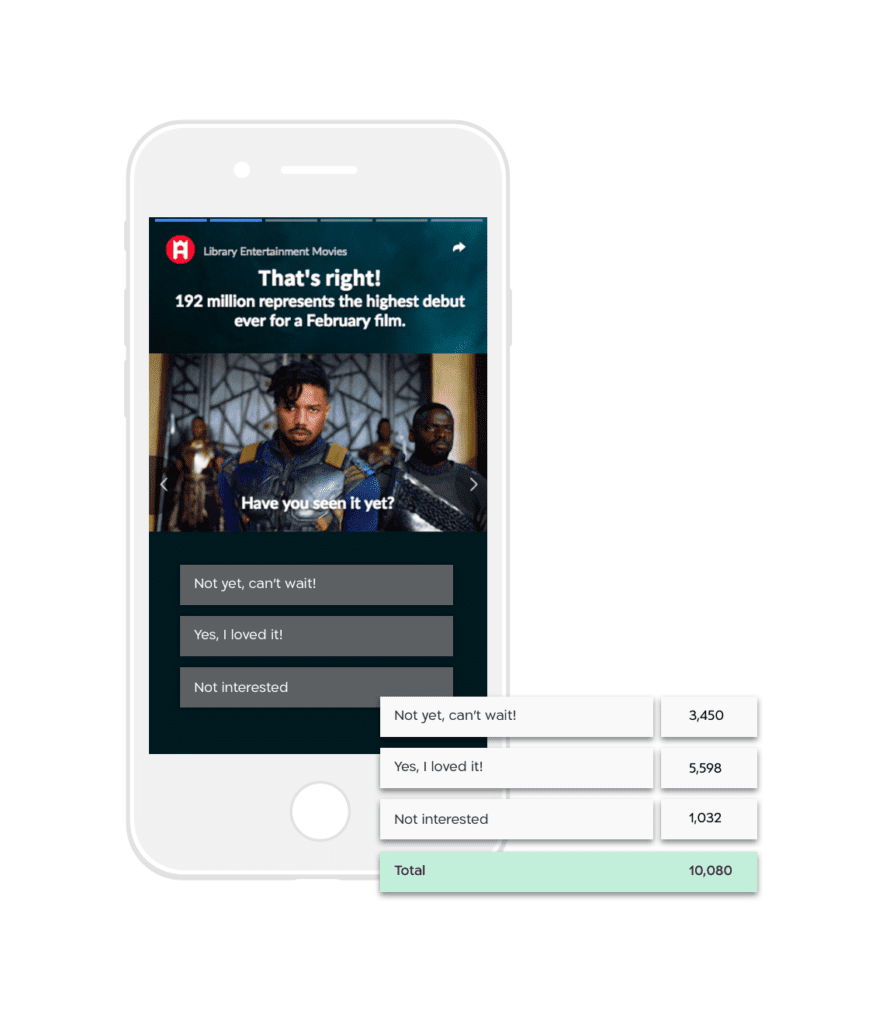
In-slide Interactions Dashboard
Learn from your audience by analyzing engagement with polls, quizzes, or Story interactive button emojis.
Get Analytics
What’s new in Apester Analytics?
- Get higher resolution by tracking performance on a content unit level
- Compare your channel’s current revenue, time on unit, and CTR to your average performance or to industry’s standard
- View each Story’s slide CTR and time performance, or choose an entire story perspective.
- Analyze Story interactions, as well as in-story polls and quizzes
- Total revenue from video ad rolls and display sources
- Explore further to see engagement over time by audience, country, domain, and/or platform to see which unit or brand produced the highest engagement or revenue.