The time users spend on your site’s page is crucial. It defines your company’s online presence, how well you’re engaging with your audience, and allows a crucial part of the digital era to unfold: data. Through users time spent on your site, brands can compile psychographic data on their users preferences, which stories are doing the best and where, their CTR, time spent on site, and more .
For the first time, we assembled data from our network brands across the globe, and located trends while increasing time on site for publishers in the last quarter of 2018. As apart of the first scale research done on interactive content, Apester found a correlation between the effects of interactive content and time spent on site.
Created with Apester Story
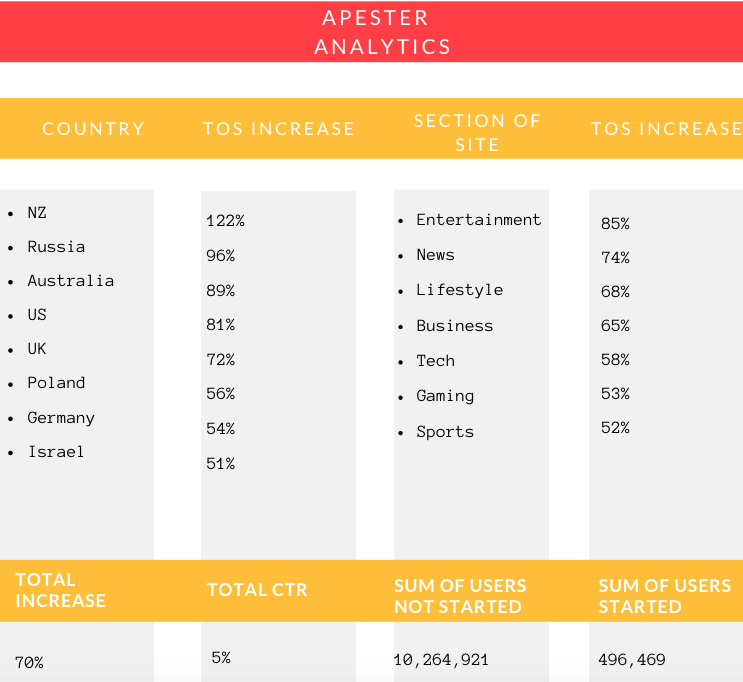
Apester works with 1,500 publishers and brands around the world. By monitoring their websites, we were able to measure traffic engagement when publications used apester and when they did not. Our results show a significant increase of time on site while using Apester, with interactive content engagement landing at an average of 70%.
When interactive content is contextual to the content, readers are more likely to educate themselves on the topic that is relevant to the article. Readers enjoy having the ability to state their opinion on debated topics, and Stories can enhance articles by presenting galleries, unfolding side stories, or stories that are related to the topic. Keeping an engaged user reading through interactive content will undoubtedly increase their time on site.
Our Results
On vertical pages, we noticed that there was an 85% increase of time spent on entertainment sites, and a 74% increase on news-related websites. Both areas ended with a CTR between 3-5%. Meaning, the share of total readers were engaged with the content per total page loadings. People like to share their views on daily news or interact with content about TV shows or an artist they are a fan of.
Of eight countries, the US showed quite an improvement, with a time on site increase of 81%. The UK’s statistic wasn’t too far behind, finishing 2018 with a 72% increase of TOS.
The desktop and mobile platform “tug-of-war” seems to have ended with mobile winning the game, with a 19% increase of users switching from desktop to mobile. Despite the increase, mobile finished the year with a 55% TOS increase, and desktop with a 65% TOS increase, waging only a 10% gap between the two platforms.
In 2018, Apester launched a new feature called, “Average Time On Unit ,” which allows publishers to know the average time it takes for readers to scroll through a story with added interactive content from Apester. As shown above, our interactive content has proven to enhance users’ time on site, ultimately serving publications and the reporters who work for them.
Contact us for a demo, or sign up and start to create interactive content.