People call it Time on Site, Total Time Spent, and even Dwell Time on Site. Whatever you call it, Apester now lets you know the average time added through engaging your readers with interactive content on your site.
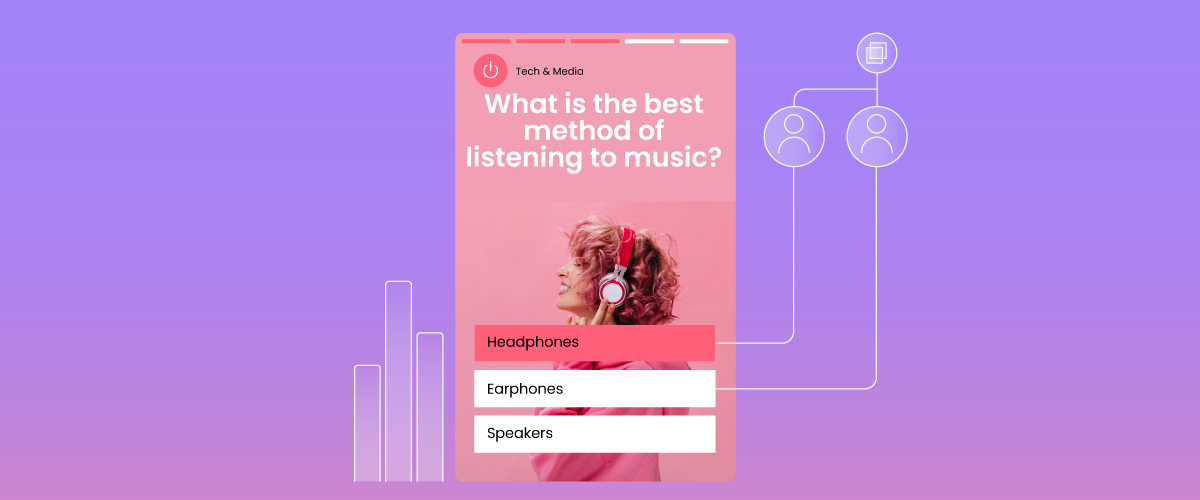
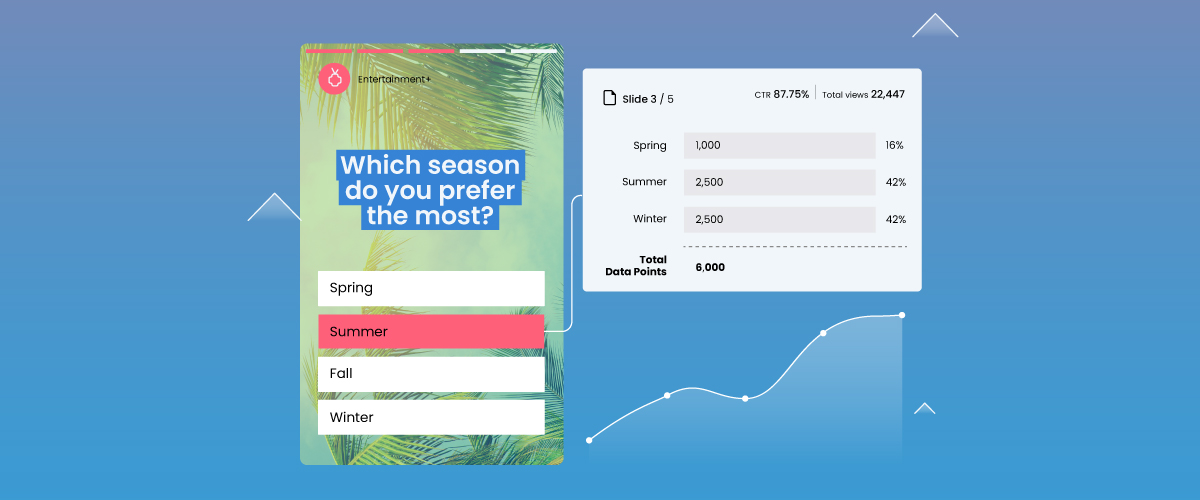
Next to each Apester content unit you create, you can now view the time added to your site from engaging your audience, in addition to other metrics already found on our dashboard such as CTR, number of views, and number of social shares.
By adding Average Time on Unit to our platform, we acknowledge the importance of time on site as a major KPI to our partner publishers, who are looking to create meaningful, memorable and insightful content to bring more value to their readers.
Designed with Apester Story
Indicating a higher level of interest and engagement, time on site is an important metric that has become crucial for publishers. More and more, they are realizing time on site has a substantial effect on recurring readership and driving subscriptions, even more than page views or virality of content.
As Facebook cut the cord on many publishers, saying it can no longer provide viable traffic to them, publishing execs are gradually striving to directly engage with their readers and provide them with significant value – they choose to reach them directly through email subscription or brand loyalty that directly leads to recurring visits. Even for ad based revenue models, high time spent on site gives buyers a sense that there are highly engaged users, better attention, and stronger impressions.
According to Digiday, publishers such as Reuters, Quartz, The Boston Globe, SF Gate, Chron.com, and the Seattle Times, are already considering Time on Site and subscription conversion as their leading KPIs. Hearst media group found a significant correlation between recurring readership and subscription: readers that have visited the site at least 10 times per month are 25 times more likely to subscribe to a newsletter than someone who doesn’t.
Apester’s interactive content proved to add significant time on site, with engaging formats such as the multi-slide Apester quiz, and the Apester Story – the first story format that allows publishers to create Instagram-like stories. Examples include TIME 100 Most Influential Person Poll, served on an Apester Story that engaged readers for almost 8 minutes, SpoilerTV’s quiz about the sci-fi show ‘The Expanse’ which added more than 6 minutes to the readers’ time on site, and People.com’s embedded Apester Story about the identity of New York Times Op-Ed writer which added 1:17 minutes.
This is a significant uplift in the metric, taking into account that the average figure for premium news website such as the New York Times and the Washington Post is 4.5-5 minutes, according to ComScore reports that were recently reported by the media.
The Apester Story format allows publishers to add features and elements that significantly increase engagement, attention, and participation, and in turn increase time on site. Editors and reporters can drag and drop GIFs, videos, custom made reaction buttons, text, images, polls, and quizzes onto the canvas to create a unique Story.
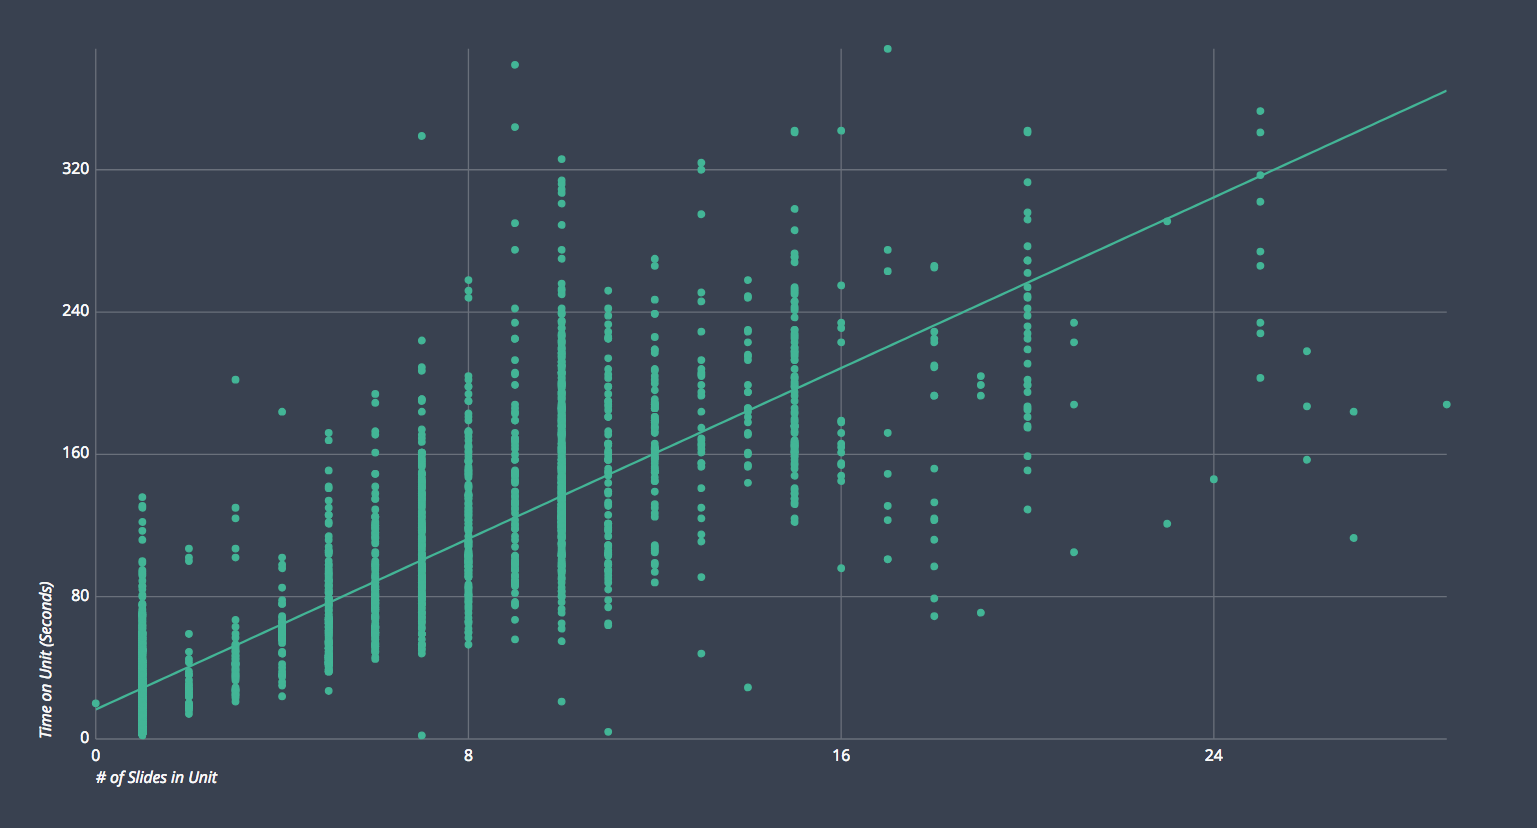
The following graph shows a linear increase in time on site as the number of slides per unit multiply. So the truth is very simple: the more slides, interactive features, and videos an editor adds, the longer the readers’ time on site is. Adding more content, whether it is presenting detailed photo galleries or summarizing a breaking news story with a timeline, means more investment in readers, who in turn are appreciative of it.
Using the Apester Feed engine – that automatically plays more and more interactive units in a queue in an everlasting feed for each user – you can multiply the time on site for a much longer period.
How we measure Average Time on Unit
We measure the time it takes a user to interact with your unit from the time the unit comes into view until the user has reached the last slide. We average only the time spent by users who started on the unit and reached all the way to the end of the unit.
At the moment, the time measured by us provides you with a full picture about the time the user spent on an Apester interactive content unit. This does not always correlate with the actual average time added to the site, as it depends on multiple factors such as the number of readers who interact with the content, the number of readers who complete the interaction (i.e completing the quiz or reaching the end of the Story experience). Apester’s teams keep generating further technologies that will soon allow us to present the actual time add as a portion of the actual average time on site. Stay tuned for more news!
Create your first Apester Story or contact us